
A solar proposal is a marketing document dressed as an invoice. The headline price, the monthly payment, and the 25-year savings figure are all chosen to make you sign, and each one can differ from reality by thousands of dollars. Here is how to find the real price hiding inside any 2026 solar quote.
- The cash price per watt is the only number that lets you compare quotes honestly. Everything else is presentation.
- Solar loan dealer fees add 15 to 30 percent to the contract price versus paying cash.
- “Adders” for electrical work, trenching, and monitoring can add $2,000 to $6,000 beyond the base quote.
- Inflated production estimates make savings look bigger than physics allows. Ask for the shading report.
- A quote that will not show a cash price, equipment list, and production estimate is a quote to reject.
The headline price is not the price
Most solar proposals lead with one of two numbers: a low monthly payment or a big 25-year savings figure. Both are derived numbers, built from assumptions the installer chose. The monthly payment depends on the loan’s dealer fee, term, and rate. The 25-year savings figure depends on assumed annual rate increases (often 4 to 6 percent, well above historical averages), assumed production, and assumed degradation. Change any assumption and the headline changes by thousands.
This is not necessarily fraud. It is sales. Every industry presents its most flattering number first. The problem is that solar is a $20,000 to $30,000 purchase you make once, so most buyers have no frame of reference for what is normal. A typical home system costs $15,000 to $28,000 in 2026, but without that context the headline numbers float free. Learning how to read a quote line by line is the defense, but first you need to understand the three places where quoted price and real price diverge.
Dealer fees: the biggest hidden markup
When a salesperson offers you a 25-year solar loan at 4.99% while mortgage rates sit near 7%, that cheap rate is not a gift. The lender charges the installer a dealer fee, typically 15 to 30 percent of the contract value, for the privilege of offering below-market rates. The installer adds that fee to your contract price. You pay it; it is just labeled as part of the system cost.
Concretely: a 7.6 kW system with a $22,800 cash price becomes a $28,500 contract on a low-rate 25-year loan with a 25% dealer fee. Your monthly payment looks great. Your total paid over 25 years can exceed $45,000 once interest is included. None of this is itemized on most proposals; the contract simply shows the higher number as “the price.”
Dealers fees are legal and standard. What matters is transparency. An honest installer shows you the cash price and the financed price side by side and lets you judge whether the cheap rate is worth the markup. A dishonest one shows only the monthly payment and hopes you never ask. Always ask. Then compare the cash price per watt across installers, because that is the number stripped of financing theater. Industry data from SEIA’s solar market research confirms that financing structures, not hardware, drive much of the price variation homeowners see.
Adders and the fine print
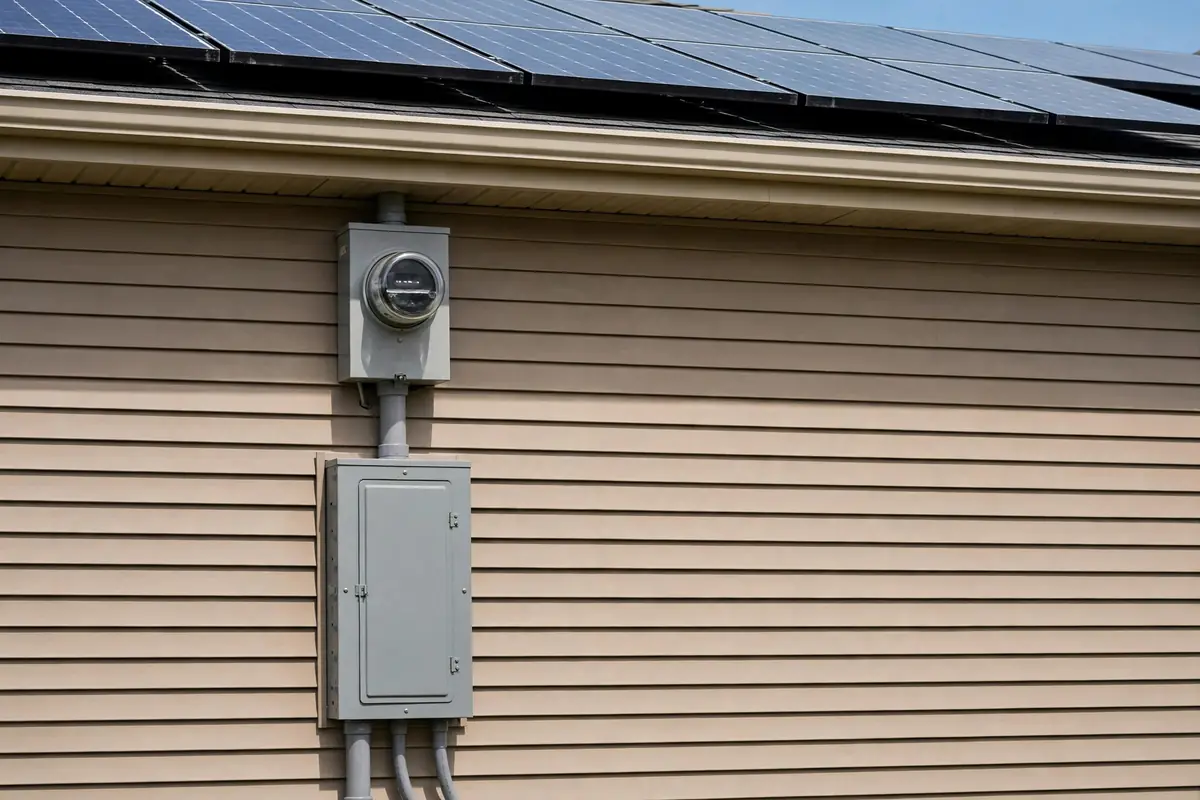
Beyond the base system price, proposals accumulate adders: line items for site-specific work. Some are legitimate and necessary. A main panel upgrade ($1,500 to $3,000), trenching for a ground mount or detached garage ($1,000 to $4,000), tile roof labor premiums ($1,000 to $2,500), and critter guards ($500 to $1,000) all reflect real labor and materials.
The issue is not that adders exist; it is that they are often vague, bundled, or sprung late. “Electrical upgrades: $2,800” with no description of what is being upgraded is not a line item, it is a shrug. Good proposals specify: “Upgrade 100A panel to 200A, includes permit and utility coordination.” Also watch for adders that duplicate standard scope. Racking, wiring, permitting, and monitoring setup are part of a normal installation; if they appear as separate adders on top of a per-watt price that already assumes them, you are being double-charged.
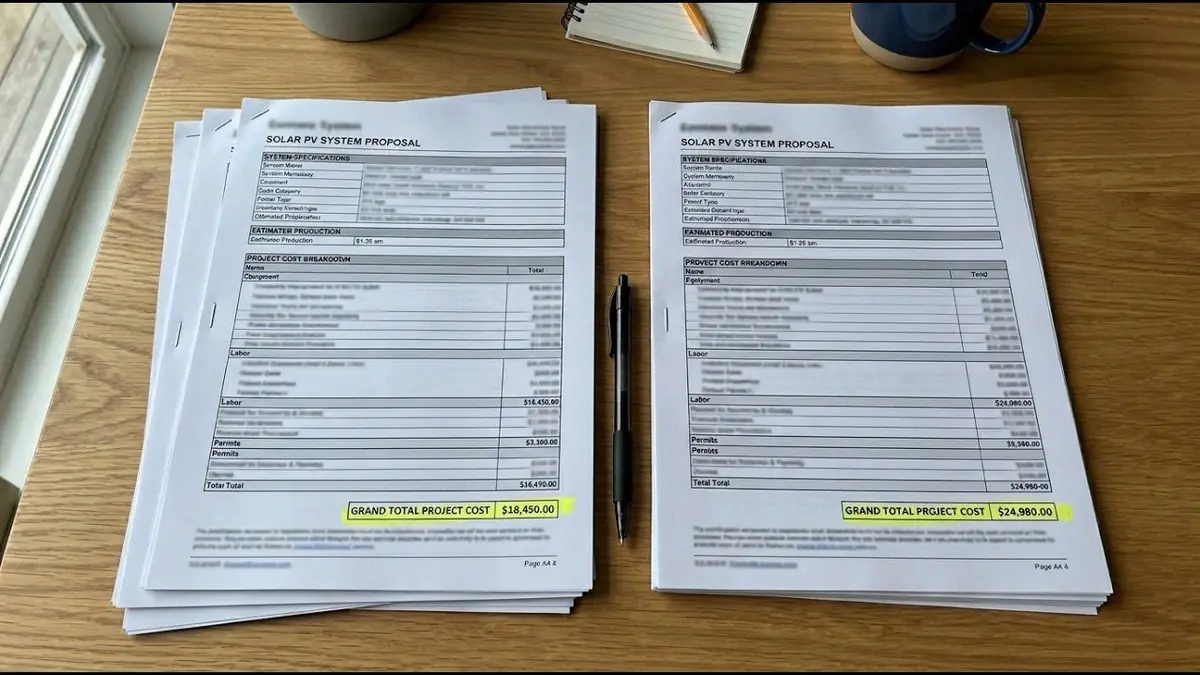
Ask for every adder to be priced and described separately, and ask which ones disappear if site conditions turn out simpler than assumed. Then check whether competing quotes include the same work in their base price. An $18,000 quote with $4,000 in adders is a $22,000 quote wearing a costume.
Production estimates and savings games
The savings figure is only as honest as the production estimate behind it, and production estimates are easy to inflate. A system in Ohio cannot produce like a system in Arizona, yet proposals sometimes use optimistic shading assumptions, ignore nearby trees, or assume panels stay perfectly clean for 25 years. Every extra 500 kWh per year in the estimate adds roughly $75 to $150 to the claimed annual savings, compounding over decades in the headline number.
Protect yourself with two requests. First, ask for the shading analysis: reputable installers generate it from satellite imagery or a site visit and can show you the expected production month by month. Second, sanity-check the estimate yourself. Divide estimated annual kWh by system kW. In most of the US, honest results fall between 1,200 and 1,700 kWh per kW per year. If a proposal shows 1,900 in Pennsylvania, the math is doing marketing, not physics. NREL’s PVWatts calculator lets you run an independent estimate for your address in minutes, and it is free.
How to find the real price
Strip every quote down to the same four numbers before comparing:
- Cash price per watt. Total cash contract divided by DC system size. This is the great equalizer. In 2026, competitive quotes cluster at $2.50 to $3.50 per watt; our 2026 worth-it guide explains the national picture.
- Equipment list with model numbers. “Tier 1 panels” is not a specification. You want panel make and model, inverter make and model, and racking type. Without model numbers you cannot verify what you are buying or compare across quotes.
- Annual production estimate with shading report. As discussed above, verified against PVWatts.
- Total 25-year cost of each financing option. Not the monthly payment: the sum of every payment plus any down payment. Compare that against the cash price to see exactly what the loan costs you.
Any installer who cannot or will not provide these four things has told you everything about how the relationship will go. The reason quotes vary so much is largely differences in sales cost and margin, not equipment, which means the informed buyer captures most of the savings just by comparing properly.
A worked example
Take two real-style quotes for a 7.6 kW system on the same roof. Installer A: $3.10/watt cash, $23,560 total, Qcells panels with Enphase microinverters, 10,900 kWh/year estimated with shading report attached. Installer B: $189/month, $0 down, 25-year loan at 5.49%, “25-year savings of $52,000,” SunPower-style premium panels named only as “premium tier 1,” production estimate 12,400 kWh/year with no shading detail.
Installer B looks cheaper per month and flashier on savings. But B’s contract price is $29,800 (the dealer fee is buried), the equipment is unverifiable, and the production estimate implies 1,630 kWh per kW in a region where PVWatts says 1,400 is realistic. Installer A’s cash price per watt is honest, the gear is specified, and the production is believable. If you finance A’s system through your own credit union at 8% with no dealer fee, you will likely pay less in total than B’s “cheap” loan. This is the entire game: the real price is always the cash price per watt on specified equipment. Everything else is commentary.
| What the quote shows | What to ask | Why it matters |
|---|---|---|
| Low monthly payment | What is the cash price? What is the dealer fee? | Reveals 15-30% financing markup |
| Big 25-year savings | What annual rate increase is assumed? | 4-6% assumptions inflate savings vs ~2-3% history |
| “Premium Tier 1 panels” | What are the exact model numbers? | Tier 1 is bankability, not quality; verify specs |
| High production estimate | Can I see the shading report? | Unverified estimates overstate savings |
| Bundle price with adders | Price each adder separately? | Exposes double-charging and padding |
Why is my financed solar quote so much higher than the cash price?
Dealer fees. Lenders charge installers 15 to 30 percent to offer below-market rates, and installers pass it through in the contract price. Ask for both prices side by side.
What is a fair price per watt in 2026?
For cash purchases, $2.50 to $3.50 per watt is the competitive national band. Financed contracts will show higher per-watt numbers because of dealer fees; normalize to cash before comparing.
Should I trust the 25-year savings number on a proposal?
Treat it as a scenario, not a promise. Check the assumed annual electricity rate increase and the production estimate. Reputable proposals state their assumptions; if yours does not, ask.
Are adders legitimate or just profit?
Many are legitimate: panel upgrades, trenching, tile roof labor. The test is specificity. A described, separately priced adder is usually fair; a vague bundled one deserves questions.
How do I verify a production estimate?
Run your address through NREL’s free PVWatts calculator and compare. Divide the installer’s annual kWh by system kW; results far above your region’s norm deserve an explanation and a shading report.
Ready to compare real solar prices?
Get free, no-pressure quotes from vetted local installers and see what solar costs for your roof.