
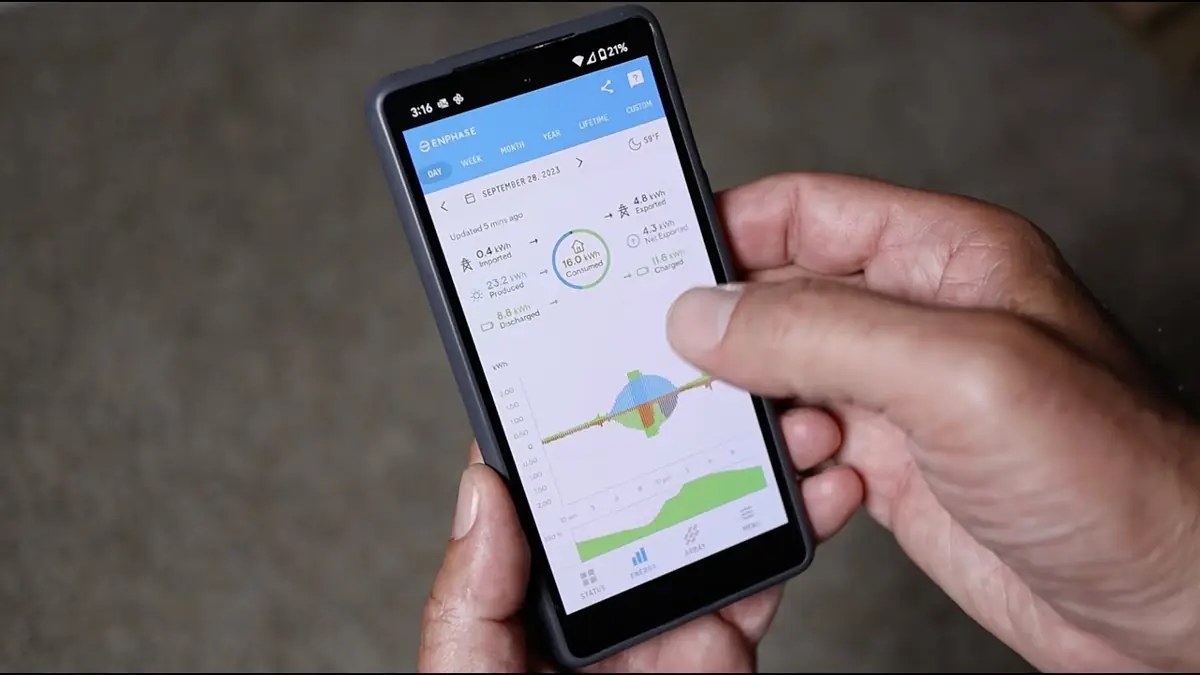
Your solar panels work silently on the roof, which means a failed component can sit unnoticed for months while your electric bill creeps up. The monitoring app on your phone is the fix: it shows every panel’s production in real time and alerts you when something drifts. This guide walks through the Enphase, SolarEdge, and Tesla apps, explains the numbers that matter, and shows you how to set up alerts that catch problems early.
- Check your monitoring app monthly; thirty seconds is enough to spot most problems.
- Panel-level monitoring turns vague “low production” into a precise diagnosis of which panel is struggling.
- The Enphase, SolarEdge, and Tesla apps all show daily curves, lifetime totals, and per-panel or per-string views.
- Set up production alerts so the app notifies you instead of you having to remember to look.
- “System offline” usually means the monitoring gateway lost internet, not that your panels stopped working.
Why Monitoring Matters
A solar array with no monitoring is a black box. Industry studies have repeatedly found that unmonitored systems underperform their potential because small faults, a dead microinverter here, a shaded string there, go unnoticed for months or years. With monitoring, the same fault is a push notification and a warranty claim within days. The financial difference over a system’s life can reach thousands of dollars.
The good news is that panel-level monitoring is now standard on most new installations. Enphase microinverter systems and SolarEdge systems with optimizers both report every panel individually, included in the base price. Older string-inverter systems may show only total output unless monitoring was added, which is worth knowing because it changes how you diagnose problems.
Make monitoring a habit, not a chore. A monthly thirty-second check is enough: open the app, look at the daily production curve for a smooth bell shape, and glance at the panel layout view for any panel producing far less than its neighbors. That tiny routine catches the large majority of issues while they are still cheap to fix, and it is the single highest-value item in solar maintenance.
The Enphase App
The Enphase app (formerly Enlighten) is the window into systems with Enphase microinverters. The home screen shows today’s energy production in kilowatt-hours, current power output, and your system’s lifetime total. Swipe to the energy graph for the daily production curve: on a clear day it should trace a smooth bell peaking around solar noon. A flat-topped curve indicates clipping, which our summer performance guide explains is usually normal.
The most powerful screen is the array view, which shows every panel as a tile colored by production. Healthy panels on a clear day show nearly identical values. A tile that is dark while its neighbors glow is your suspect: note the panel’s position and check it for shade, droppings, or debris. If it stays dark across several sunny days, that microinverter has likely failed and needs a warranty replacement.
If you have Enphase batteries or consumption monitoring with current transformers (CTs) installed, the app also shows home consumption, grid import and export, and battery charge level. The energy independence score tells you what share of your usage your system covered. Enphase’s own app walkthrough demonstrates these features with screenshots. These extras turn the app from a production checker into a full home energy dashboard.
The SolarEdge App
The mySolarEdge app serves systems with SolarEdge inverters and optimizers. Its dashboard mirrors the Enphase experience: daily, monthly, and lifetime production, a system power flow view, and a layout screen showing every panel’s output through its optimizer. Because SolarEdge uses a central inverter, the app also surfaces inverter status prominently, including any error codes.
SolarEdge’s layout view is particularly useful for shade diagnosis. Since optimizers report per-panel data, you can watch a shadow sweep across the array through the morning and identify exactly which panels are affected and for how long. That precision helps you decide whether trimming a tree is worth the cost.
One SolarEdge-specific habit: check the inverter status tile, not just production. The app distinguishes between the inverter producing, the inverter in night mode, and the inverter faulted. If you see a fault code here, our guide on inverter error codes walks through what to do next, starting with the safe checks before you call anyone.
The Tesla App
Tesla solar and Powerwall owners use the Tesla app, which takes a different approach: instead of leading with per-panel data, it leads with energy flow. The home screen animates power moving between your solar, Powerwall, home, and the grid in real time, which makes the system’s behavior intuitive at a glance. Swipe up for the energy graphs by day, week, month, and year.
The Tesla app excels at battery management. You can set backup reserve percentages, switch between self-powered and time-based control modes, and enable Storm Watch for automatic pre-charging before severe weather. For troubleshooting, the app is thinner on panel-level detail than Enphase or SolarEdge, so production anomalies are harder to localize without installer tools.
If you are choosing between battery ecosystems, the app experience is a legitimate factor alongside specs and price. Our Powerwall 3 vs Enphase 5P comparison covers how the two platforms differ on monitoring as well as hardware.
The Numbers That Actually Matter
Monitoring apps throw a lot of numbers at you. Most can be ignored most of the time. The table below lists the few worth understanding.
| Metric | What it means | Why it matters |
|---|---|---|
| Energy (kWh) | Total electricity produced over a period | Compare monthly totals to last year and to your installer’s estimate |
| Power (kW) | Instantaneous output right now | Midday peaks reveal clipping, shade, and heat effects |
| Panel-level output | Each panel’s production vs its neighbors | Finds failed microinverters, shade, and soiling precisely |
| Specific yield (kWh/kW) | Production per installed kilowatt | Lets you fairly compare systems of different sizes |
| Consumption (kWh) | What your home used, if CTs installed | Shows self-consumption vs export; key for bill math |
| Lifetime energy | Total produced since installation | Tracks long-term degradation trends year over year |
Two comparisons do most of the diagnostic work. First, this month versus the same month last year, which controls for seasons and reveals degradation or new faults. Second, each panel versus its neighbors on the same day, which isolates panel-specific problems from weather. If both comparisons look clean, your system is healthy regardless of what the raw numbers say.
Setting Up Alerts
Do not rely on memory to check the app; let the app tap you on the shoulder. Both Enphase and SolarEdge let you configure email or push alerts for production issues, communication losses, and inverter faults. Turn on at least two: a system production alert that fires when daily output drops significantly below expected, and a communication alert for when the gateway goes offline.
Set alert thresholds thoughtfully. Too sensitive, and every cloudy week spams you into ignoring them. A good starting point is alerting when daily production falls more than about 25% below the expected value for similar weather, or when any panel produces zero for a full sunny day. You can tighten thresholds once you learn your system’s normal variation.
For Enphase owners, the Enlighten Manager web portal (free for system owners) offers more granular alerting than the phone app, including per-panel production alerts. It is worth the one-time setup. Enphase’s monitoring guide explains what the platform can track. SolarEdge’s monitoring portal similarly offers deeper configuration than the mobile app for owners who want it.
When Monitoring Goes Offline
The most common monitoring problem is not a fault at all: the gateway loses its internet connection and the app shows stale data or “system offline.” Enphase gateways and SolarEdge inverters connect via Wi-Fi, ethernet, or cellular, and home network changes are the usual culprit. New router, new Wi-Fi password, or a gateway that got unplugged during spring cleaning account for most cases.
Fix it in this order: confirm your home internet works, check that the gateway is powered (status lights on), and re-enter Wi-Fi credentials if the network changed. Enphase’s installer toolkit app and SolarEdge’s SetApp can reconfigure connections, though some steps need installer access. If the gateway is powered and the network is fine but it stays offline, power-cycle the gateway once.
Remember the key reassurance: an offline gateway does not stop production. Your panels keep generating and your meter keeps crediting you; only the reporting pauses, and most systems backfill the missing data once reconnected. Do not let an offline app convince you the system is broken before checking the meter.
How often should I check my solar monitoring app?
A thirty-second glance once a month is enough for most owners. Set up automatic alerts as well, so the app notifies you of problems instead of relying on you to remember.
Why does one panel produce less than the others?
Usually shade, dirt, or debris on that specific panel. If it stays low across several sunny days after cleaning, the microinverter or optimizer may have failed, which is a warranty issue.
My app says the system is offline. Is my solar broken?
Probably not. Nine times out of ten the monitoring gateway lost its internet connection while the panels kept producing. Check your Wi-Fi and the gateway’s power before worrying.
Can I monitor my system without panel-level data?
Yes, but diagnosis is harder. Older string systems show only total output, so you compare monthly totals against expectations and call a technician for panel-level investigation when something looks off.
Do monitoring apps cost money?
Basic monitoring is free for the life of the system with Enphase, SolarEdge, and Tesla. Some installers offer premium fleet-style dashboards, but homeowners rarely need them.
Get the most from your solar investment
Compare vetted installers with full panel-level monitoring included. Free quotes, no pressure.